Filtering Application Insights
Application Insights is a valuable tool to monitor your application, but the amount of gathered telemetry can grow very large. In this post, I will give you some options to reduce the amount of logging and what the trade-offs are.
What is the problem?
Application Insights is great to monitor the duration of all requests and dependencies (i.e. SQL queries). All requests are logged, so you can determine the average request duration and spot slow requests. But what if you have a lot of requests and are only interested in the slow ones? With standard AI, you are out of luck and need to collect all requests and filter out the slow ones during analysis.

Another important aspect is being able to track down what happened when an operation failed. All telemetry for a specific operation is linked to that operation, so it’s easy to find out what happened and why the operation failed. You add a lot of traces to be able to track down what happened in case an operation failed, but when deployed to a production system the amount of logging data becomes huge. The verbose data is only relevant for failed operations, but you don’t know that the operation is going to fail when you emit the traces.
There are several disadvantages in logging too much telemetry to AI:
- You pay per GB and while it may only cost about $2 per GB, it can become expensive when you have a lot of telemetry.
- Sending the telemetry requires bandwidth and processing power.
It would be a good idea to keep only the telemetry that you are interested in.
Reducing the amount of telemetry
Application Insights supports sampling to reduce the amount of telemetry. If there is a lot of telemetry, then it will only send a subset of the telemetry. Although this reduces telemetry data, you have limited control of what is being sent to Application Insights. You might also exclude a slow dependency by accident.
Fortunately, AI also support the concept of telemetry processors. Almost all AI telemetry is linked to an operation, so what if we could use minimal logging for successful request, but keep all the verbose logging for failed requests? The example above would then only log the following telemetry:
All traces were linked to the request, so we hold back these traces. When the request completes successfully, the traces are discarded and only the request is sent. When the request failed, then all telemetry related to the request is sent.
Disadvantages
As with all upsides, there are some downsides as well. The current implementation keeps all telemetry, that is hold back, in memory. If you have long running, highly parallel requests with a lot of telemetry, then memory usage can become significant. When an operation never completes, then telemetry is kept in memory forever. Most operations will be started with a using operation, so they will always complete eventually.
Running statistics on your telemetry is tricky, because not all telemetry is there anymore. Only dependencies of failed calls are logged and these durations might not be representative for normal operations. Only you can decide what is useful to log and what is not. You might want to keep the dependency telemetry in, but only remove all traces with severity level ‘Informational’ or lower. It’s up to you.
Sample implementation
This is a sample implementation that can be extended to your own needs. The most important part are the concurrent collections to provide a thread-safe processor. The implementation is very basic. It removes all telemetry (including slow dependencies) for successful requests.
public class FilteringTelemetryProcessor : ITelemetryProcessor
{
    private readonly ITelemetryProcessor _next;
	private readonly ConcurrentDictionary<string, ConcurrentQueue<ITelemetry>> _operations =
                 new ConcurrentDictionary<string, ConcurrentQueue<ITelemetry>>();

    public FilteringTelemetryProcessor(ITelemetryProcessor next)
    {
        _next = next;
    }

    public void Process(ITelemetry item)
    {
        // Obtain the operation identifier
        var operationId = item.Context.Operation?.Id;
        if (operationId != null)
        {
            // All operations are started via a request
            var request = item as RequestTelemetry;
            if (request != null)
            {
                // Obtain (and remove) the telemetries for this operation
                var found = _operations.TryRemove(operationId,
                                           out ConcurrentQueue<ITelemetry> telemetries);

                // Send all the logging for the operation if the operation failed
                if (found && request.Success.HasValue && !request.Success.Value)
                {
                    ITelemetry telemetry;
                    while (telemetries.TryDequeue(out telemetry))
                        _next.Process(telemetry);
                }
            }
            else
            {
                // Obtain the telemetries for this operation
                var telemetries = _operations.GetOrAdd(operationId,
                                                  _ => new ConcurrentQueue<ITelemetry>());
                telemetries.Enqueue(item);
                return;
            }
        }

        // Process the item
        _next.Process(item);
    }
}
A more advanced implementation is available on GitHub and there is also a NuGet package available if you want to use the module without any modifications. It is compatible with .NET 4 (and later) and .NET core. Using Application Insights on .NET core is a bit different, so check out the demo applications for more information.
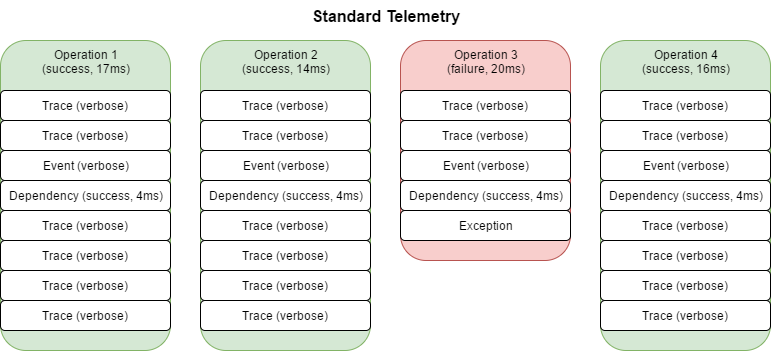
The demo application shows what the filter does. Without filtering the following events are emitted to Application Insights:
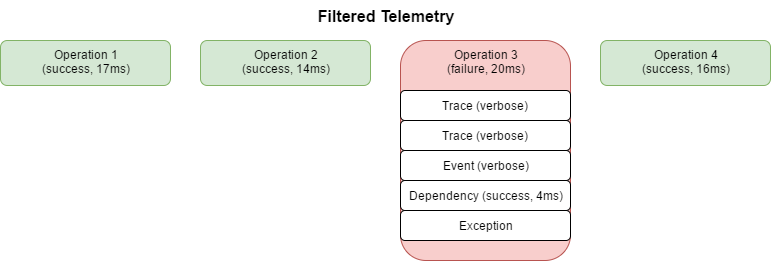
With the filtering active, only the slow dependencies and traces for failed requests are sent to Application Insights and drastically reducing the amount of telemetry. In this example every 10th call fails, so with actual production load the savings will be much more:
The telemetry processor can be injected by adding the <TelemetryProcessors> tag to your configuration:
<?xml version="1.0" encoding="utf-8"?>
<ApplicationInsights xmlns="http://schemas.microsoft.com/ApplicationInsights/2013/Settings"
                     schemaVersion="2014-05-30">
  <TelemetryProcessors>
    <!-- Operation filter reduces telemetry for successful operations. -->
    <Add Type="RamonDeKlein.AI.OperationFilterProcessor, RamonDeKlein.AI">
      <AlwaysLogExceptions>True</AlwaysLogExceptions>
      <AlwaysLogFailedDependencies>True</AlwaysLogFailedDependencies>
      <AlwaysTraceDependencyWithDuration>0:0:0.150</AlwaysTraceDependencyWithDuration>
      <MinAlwaysTraceLevel>Warning</MinAlwaysTraceLevel>
      <IncludeOperationLessTelemetry>True</IncludeOperationLessTelemetry>
    </Add>
  </TelemetryProcessors>
  <InstrumentationKey>...insert-your-key-here...</InstrumentationKey>
</ApplicationInsights>
Improvements
You probably want to log trace messages with high severity levels, slow dependencies, exceptions, … It’s best to take a look at the GitHub repository and to extend it to your needs. If you think you have a neat extension and would like to share it, then please submit a pull request.